Sunday, July 27, 2014

Jmeter -To start with

JMETER

Apache JMeter is a 100% pure Java Desktop application designed to load-test functional behavior and measure performance. It was originally designed for testing Web Applications but has since expanded to other test functions. JMeter can be used as a unit test tool for JDBC database connections, FTP, LDAP, Web services and JMS.

If you are not aware of the basics related to JMETER then please refer to the following link for 10 min before reading this complete article.

http://jmeter.apache.org/usermanual/build-web-test-plan.html

The JMETER tool looks difficult to understand quickly since the new user does not have the basic knowledge to create a load test environment. This article will concentrate only on one of the best ways to record a web application using Workbench (file provided in code files) and run load tests in a similar way, like fro example QTP or Visual Studio - CodedUI.

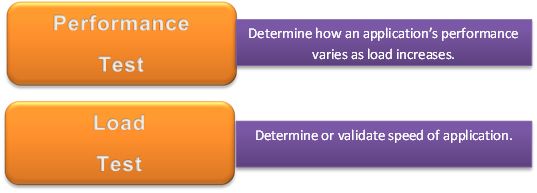
Difference between performance and load testing
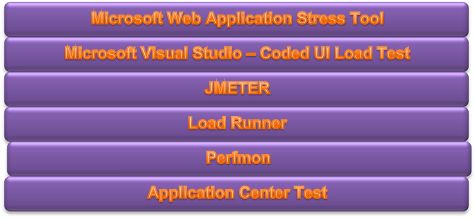
JMETER-1.jpg

Load Testing Tools

JMETER-2.jpg

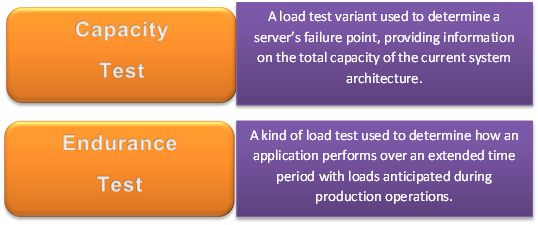
Various types of load test variants

JMETER-3.jpg

Example of Requirement of load testing:

  • Given a load of 50 requests per second for this URL and no other requests
  • Within database CPU utilization and under 20% and Web Server CPU utilization of under 10%
To analyze the load testing results:
  • To check the performance of the web page the average value of receiving the page is an important parameter to check
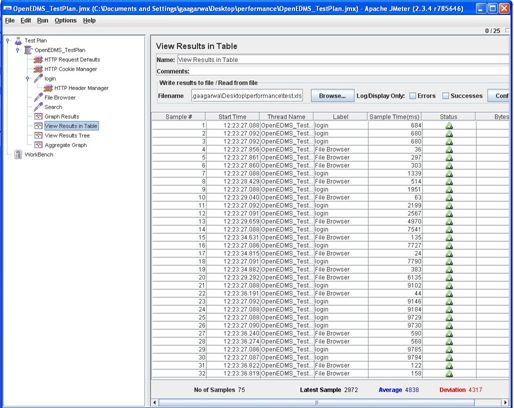
  • Samples: A sample means one sampler call. One request to a web page in our case. So the value of 51 means a total of 51 web page requests to the page, for example "http://www.google.com", were made by JMeter
  • Average: This value is the average time taken to receive the web pages. There were 51 values of receiving time that were added and divided by 51 and this value is arrived by JMeter. This value is a measure of performance of this web page. This means on an average 334 milliseconds is required to receive this web page for our network conditions.
  • Min and Max: These are the minimum and maximum values of time required for receiving the web page.
  • Std. Dev: This shows how many exceptional cases were found that were deviating from the average value of the receiving time. The lesser this value more consistent the time pattern is assumed.
  • Error %: This value indicated the percentage of error. For example 51 calls were made and all are received successfully this means 0 error. If there are any calls not received properly they are counted as errors and the percentage of error occurrence against the actual calls made is displayed in this value.
Terminology
Before we dive into the step-by-step instructions, it's a good idea to define the terms and ensure the definition is clear.

Master: the system running Jmeter GUI, that controls the test
Slave: the system running jmeter-server, that takes commands from the GUI and send requests to the target system(s)
Target: the webserver we plan to stress test

Note: Starting the Test
Before start load testing, if you want to double check that the slave systems are working then open jmeter.log in Notepad. You should see the following in the log. Jmeter.engine.RemoteJMeterEngineImpl: Starting backing engine. If you do not see this message then it means the JMETER server did not start correctly.


  1. Download JMETER binary release from http://jmeter.apache.org/download_jmeter.cgi
  2. Extract the zip file and go to bin folder.
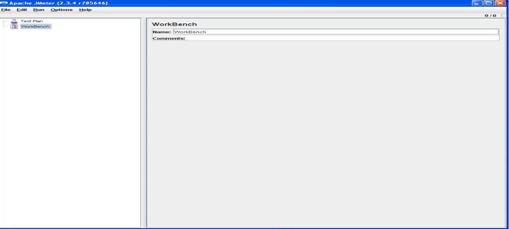
  3. Double-click "jmeter.bat"
  4. This will start the JMETER application and the following screen will be displayed:

    JMETER-4.jpg

    Part 1: How to record your web applications using Workbench for load test.

    As mentioned above, JMETER looks like a difficult tool to understand quickly, since the new user does not have the basic knowledge to create a load test environment. The following provides one of the best ways to record the web application using Workbench and run load tests like for example QTP or Visual Studio - CodedUI.
     
  5. Go to File Open.
  6. Browse the sample test plan attached with this article for TestPlan2.jmx.jmx or Sample.jmx and click open.
  7. This will open the screen as shown below:

    JMETER-5.jpg
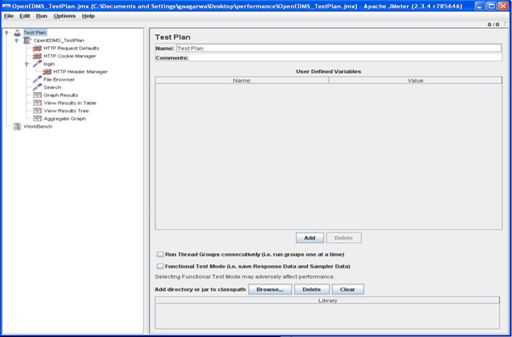
  8. Click on TestPlan2 on the left panel and edit the field "Number of Threads(users)": 25 on the right panel. Provide the desired figure with which testing is required to be conducted.
  9. Click on "HttpRequestDefaults" on the left panel and edit the Server Name or IP : 152.425.306.120 and Port Number:8080 (if the Tomcat Server is running on port other than 8080) on the right panel. Do not give the Server Name as "localhost". The field should contain the machine name or IP.
  10. There are already 3 http requests created. In other words Login, File Browser and Search. You can run the test plan to test performance for these 3 requests. You can also add new requests to test against specific criteria. This is discussed later on.
  11. In order to run the test plan, go to Run Start. Please ensure the Tomcat Server is running.
  12. This will start executing the test plan.
  13. Once the test plan execution is complete, you can see the result in various formats as explained below.
  14. Click on Graph Results on the right panel. This displays the time taken for each request by plotting the requests on the x-y axis.

    JMETER-6.jpg
  15. Click on "View Results" in the table to see the results in tabular format

    JMETER-7.jpg
  16. Click on View Results Tree to view request and response data for each request.
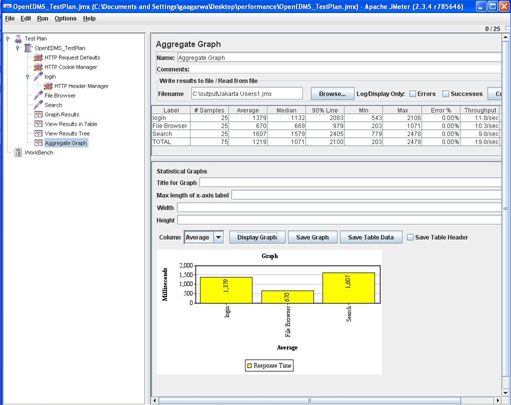
  17. Click on "Aggregate Graph". Then click on "Display Graph" on the right panel. This will render the results in a graphical view.

    JMETER-8.jpg
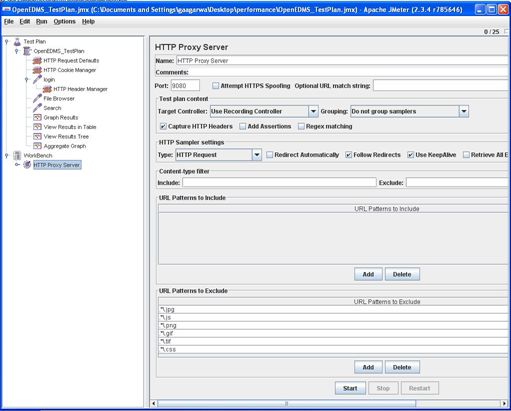
  18. In order to create your own request for a specific search criteria, a proxy server needs to be set up that will record the request to be tested.
  19. Right-click on WorkBench and select "Merge". Browse through the file "WorkBench.jmx" and click on "Open".
  20. Click on "Http Proxy Server" on the left panel. By default, the proxy server is configured to run at 9080 port. If you want to run on a different port then edit the Port field on the right panel and then click on the Start button present towards the end. This will start the proxy server.

    JMETER-9.jpg
  21. Now open Internet Explorer and login into OpenEDMS. Again ensure you access the application with server name or IP and not localhost.
  22. Click on the "Advance Search Tab".
  23. In order to start recording the search, the proxy server needs to be set up in IE.
  24. Go to "Tools" | "Internet Options" | "Connections LAN Settings"

    JMETER-10.jpg
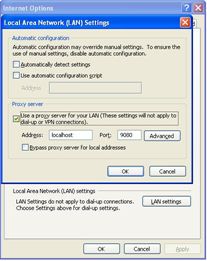
  25. Tick the checkbox "Use a proxy server for your LAN" and provide the address and port as per the configuration done previously.
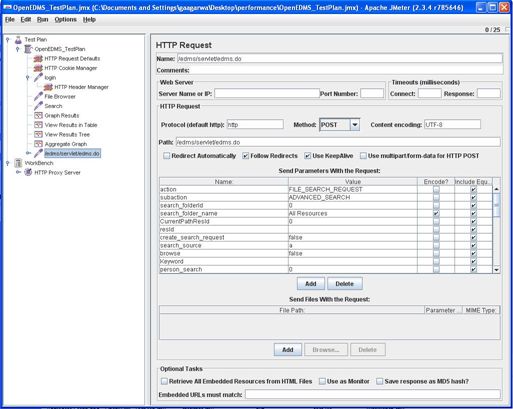
  26. Now as soon as you click on "Search" after filling the search criteria, a new request will be added in JMeter as shown.
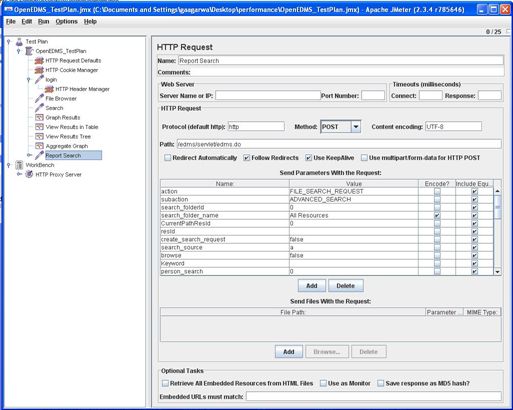
    JMETER-11.jpg
  27. You can provide some meaningful name instead of "/edms/servlet/edms.do" for example Report Search in the Name field on the right panel

    JMETER-12.jpg
  28. Now drag on the Report Search item on the left panel and place it above the Graph Results as shown below.

    JMETER-13.jpg
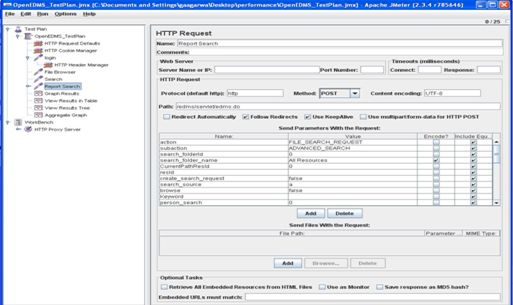
  29. This way you can create your own search criteria to be tested. Now follow the same procedure to run the test as was mentioned earlier and view the results in desired formats.  

Monday, July 14, 2014

Response time Vs LatencyVs Processtime


Latency is the delay incurred in communicating a message (the time the message spends “on the wire”). The word latent means inactive or dormant, so the processing of a user action is latent while it is traveling across a network.
Changes in latency are typically unavoidable through changes to your code. Latency is a resource issue, which is affected by hardware adequacy and utilization.
Example: The latency in a phone call is the amount of time it takes from when you ask a question until the time that the other party hears your question. If you’ve ever talked to somebody on a cell phone while standing in the same room, you’ve probably experienced latency first hand, because you can see their lips moving, but what you hear in the phone is delayed because of the latency.
Response time is the total time it takes from when a user makes a request until they receive a response.
Response time can be affected by changes to the processing time of your system and by changes in latency, which occur due to changes in hardware resources or utilization.
Example: The response time in phone conversation is the amount of time it takes for you to ask a question and get a response back from the person that you’re talking to.
Processing time is the amount of time a system takes to process a given request, not including the time it takes the message to get from the user to the system or the time it takes to get from the system back to the user.
Processing time can be affected by changes to your code, changes to systems that your code depends on (e.g. databases), or improvements in hardware.
Example: The processing time in a phone conversation is the amount of time the person you ask a question takes to ponder the question and speak the answer (after he hears the question of course).
In these terms:
Latency + Processing Time = Response Time
In many cases, you can assert that your latency is nominal, thus making your response time and your processing time pretty much the same. I guess it doesn’t matter what you call things as long as everybody involved in your performance analysis understands these different aspects of the system. For example, it is useful to make a graph latency vs. response time, and it is important for all the parties involved to know the difference between the two.

Short Interview with Jmeter

Quality Analyst: Hello JMeter can you tell us something about yourself?
Apache JMeter: Hello!  I am a load testing tool.  If you tell me how to perform a certain action I can simulate multiple users doing that action.  This is like cloning users, isn't it?  I am a child of Apache Jakarta project, technically sub project of Apache Jakarta project.  I was created initially to test performance of web sites, but you know what, now I help people test many more things like database performance, FTP server performance and much more.

Quality Analyst: We heard that sometimes you talk Java and Javascript language?  Is this true, and do we Quality Analysts have to know Java or JavaScript to talk with you?
Apache JMeter: Well, simple scenerios of testing can be done with no knowledge of JavaScript but for advanced functional testing you should know JavaScript.  Java is needed only if you are using Java Sampler part of my abilities and if you want to extend my capabilities.
Quality Analyst: You mentioned functional testing just now, so can you also help us testing our software functionally?
Apache JMeter: The answer is yes.  I can help you test the software functionally.  This requires thorough knowledge of the Sampler you are using.  For example in case of web site testing HTTP Request Sampler is used so the request and response patterns of this sampler shall be known to the user.  They can then write assertions on the response to check whether the response was as expected and hence functionally check the response.

Quality Analyst: Do you like a particular browser?
Apache JMeter: This question is confusing.  Let me clear some points first.  I am not a browser.  No, I am not a browser in traditional sense.  Yes I can visit a web site just like a browser do (through my HTTP Request Sampler and HttpClient Sampler) but I do not show that web site on screen exactly as a browser do.  My job is to visit a web site and capture the response sent by that web site.  I can show you the response as TEXT, XML or even in terms of HTML but without executing any JavaScript on that page.

So there is no question of me liking any browser. Browsers and I are different things.  My behaviour is different than any existing browser.

Quality Analyst: I know that you help us record our actions and then you can play them again.  My question is, are those recordings OS dependant?  In other words if I record something on Linux, can I play those actions on a Windows workstation?
Apache JMeter: Oh yes you can.  I can save Test Plans for you and those test plans are in XML format so they have nothing to do with any particular OS.  You can run those test plans on any OS where I can run.

Core Performance testing Activities

Core Performance Testing Activities
  1. Activity 1. Identify the Test Environment.  Identify the physical test environment and the production environment as well as the tools and resources available to the test team. The physical environment includes hardware, software, and network configurations. Having a thorough understanding of the entire test environment at the outset enables more efficient test design and planning and helps you identify testing challenges early in the project. In some situations, this process must be revisited periodically throughout the project’s life cycle.
  2. Activity 2. Identify Performance Acceptance Criteria.  Identify the response time, throughput, and resource utilization goals and constraints. In general, response time is a user concern, throughput is a business concern, and resource utilization is a system concern. Additionally, identify project success criteria that may not be captured by those goals and constraints; for example, using performance tests to evaluate what combination of configuration settings will result in the most desirable performance characteristics.
  3. Activity 3. Plan and Design Tests.  Identify key scenarios, determine variability among representative users and how to simulate that variability, define test data, and establish metrics to be collected. Consolidate this information into one or more models of system usage to be implemented, executed, and analyzed.   
  4. Activity 4. Configure the Test Environment.  Prepare the test environment, tools, and resources necessary to execute each strategy as features and components become available for test. Ensure that the test environment is instrumented for resource monitoring as necessary.
  5. Activity 5. Implement the Test Design.  Develop the performance tests in accordance with the test design.
  6. Activity 6. Execute the Test.  Run and monitor your tests. Validate the tests, test data, and results collection. Execute validated tests for analysis while monitoring the test and the test environment.
  7. Activity 7. Analyze Results, Report, and Retest.  Consolidate and share results data. Analyze the data both individually and as a cross-functional team. Reprioritize the remaining tests and re-execute them as needed. When all of the metric values are within accepted limits, none of the set thresholds have been violated, and all of the desired information has been collected, you have finished testing that particular scenario on that particular configuration.

Performance Testing Types

Performance Testing

Performance testing is defined as the technical investigation done to determine or validate the speed, scalability, and/or stability characteristics of the product under test. Performance-related activities, such as testing and tuning, are concerned with achieving response times, throughput, and resource-utilization levels that meet the performance objectives for the application under test. Because performance testing is a general term that covers all of its various subsets, every value and benefit listed under other performance test types in this chapter can also be considered a potential benefit of performance testing in general.

Key Types of Performance Testing

The following are the most common types of performance testing for Web applications.
TermPurposeNotes
Performance testTo determine or validate speed, scalability, and/or stability.
  • A performance test is a technical investigation done to determine or validate the responsiveness, speed, scalability, and/or stability characteristics of the product under test.
Load testTo verify application behavior under normal and peak load conditions.
  • Load testing is conducted to verify that your application can meet your desired performance objectives; these performance objectives are often specified in a service level agreement (SLA). A load test enables you to measure response times, throughput rates, and resource-utilization levels, and to identify your application’s breaking point, assuming that the breaking point occurs below the peak load condition.
  • Endurance testing is a subset of load testing. An endurance test is a type of performance test focused on determining or validating the performance characteristics of the product under test when subjected to workload models and load volumes anticipated during production operations over an extended period of time.
  • Endurance testing may be used to calculate Mean Time Between Failure (MTBF), Mean Time To Failure (MTTF), and similar metrics.
Stress testTo determine or validate an application’s behavior when it is pushed beyond normal or peak load conditions.
  • The goal of stress testing is to reveal application bugs that surface only under high load conditions. These bugs can include such things as synchronization issues, race conditions, and memory leaks. Stress testing enables you to identify your application’s weak points, and shows how the application behaves under extreme load conditions.
  • Spike testing is a subset of stress testing.  A spike test is a type of performance test focused on determining or validating the performance characteristics of the product under test when subjected to workload models and load volumes that repeatedly increase beyond anticipated production operations for short periods of time.
Capacity testTo determine how many users and/or transactions a given system will support and still meet performance goals.
  • Capacity testing is conducted in conjunction with capacity planning, which you use to plan for future growth, such as an increased user base or increased volume of data. For example, to accommodate future loads, you need to know how many additional resources (such as processor capacity, memory usage, disk capacity, or network bandwidth) are necessary to support future usage levels.
  • Capacity testing helps you to identify a scaling strategy in order to determine whether you should scale up or scale out.
The most common performance concerns related to Web applications are “Will it be fast enough?”, “Will it support all of my clients?”, “What happens if something goes wrong?”, and “What do I need to plan for when I get more customers?”. In casual conversation, most people associate “fast enough” with performance testing, “accommodate the current/expected user base” with load testing, “something going wrong” with stress testing, and “planning for future growth” with capacity testing. Collectively, these risks form the basis for the four key types of performance tests for Web applications.

Summary Matrix of Benefits by Key Performance Test Types

TermBenefitsChallenges and Areas Not Addressed
Performance test
  • Determines the speed, scalability and stability characteristics of an application, thereby providing an input to making sound business decisions.
  • Focuses on determining if the user of the system will be satisfied with the performance characteristics of the application.
  • Identifies mismatches between performance-related expectations and reality.
  • Supports tuning, capacity planning, and optimization efforts.
  • May not detect some functional defects that only appear under load.
  • If not carefully designed and validated, may only be indicative of performance characteristics in a very small number of production scenarios.
  • Unless tests are conducted on the production hardware, from the same machines the users will be using, there will always be a degree of uncertainty in the results.
Load test
  • Determines the throughput required to support the anticipated peak production load.
  • Determines the adequacy of a hardware environment.
  • Evaluates the adequacy of a load balancer.
  • Detects concurrency issues.
  • Detects functionality errors under load.
  • Collects data for scalability and capacity-planning purposes.
  • Helps to determine how many users the application can handle before performance is compromised.
  • Helps to determine how much load the hardware can handle before resource utilization limits are exceeded.
  • Is not designed to primarily focus on speed of response.
  • Results should only be used for comparison with other related load tests.
Stress test
  • Determines if data can be corrupted by overstressing the system.
  • Provides an estimate of how far beyond the target load an application can go before causing failures and errors in addition to slowness.
  • Allows you to establish application-monitoring triggers to warn of impending failures.
  • Ensures that security vulnerabilities are not opened up by stressful conditions.
  • Determines the side effects of common hardware or supporting application failures.
  • Helps to determine what kinds of failures are most valuable to plan for.
  • Because stress tests are unrealistic by design, some stakeholders may dismiss test results.
  • It is often difficult to know how much stress is worth applying.
  • It is possible to cause application and/or network failures that may result in significant disruption if not isolated to the test environment.
Capacity test
  • Provides information about how workload can be handled to meet business requirements.  
  • Provides actual data that capacity planners can use to validate or enhance their models and/or predictions.
  • Enables you to conduct various tests to compare capacity-planning models and/or predictions.
  • Determines the current usage and capacity of the existing system to aid in capacity planning.
  • Provides the usage and capacity trends of the existing system to aid in capacity planning
  • Capacity model validation tests are complex to create.
  • Not all aspects of a capacity-planning model can be validated through testing at a time when those aspects would provide the most value.